Photogrammar was created by a team of 8 academics from Yale, the University of Virginia, and the University of North Carolina, Chapel Hill specializing in American studies, digital humanities, English, statistics, GIS, and technology. The goal of this project is to make photographs gathered by the Office of War Information during the Great Depression easily accessible online. Beyond making the photos accessible, the project has created multiple tools that allow users to see trends, demographics, and the work of particular photographers.
The intended audience of this project is primarily historians, photographers, or people like me who just enjoy looking at old photographs. There are a couple different ways to search for materials on this website, enabling users to search for photos from specific times and places. This is especially useful for academics researching the great depression in a certain state or even county. They can use the map to easily search their desired area and year.
The project does not list anywhere what was learned from categorizing these photographs, but it becomes clear in searching on the website which counties were focused on more by the OWI photographers. While this doesn’t offer any solid conclusions, it does beg the question of why certain counties were heavily trafficked by OWI photographers while others were ignored.
In order to make the OWI photographs accessible, the Photogrammar team organized them using a classification system that was designed in the 1940s for this particular government project. Paul Vanderbilt developed a lot number and classification tag system in 1942 to organize the OWI photographs. Under this system, classification tags were placed on each photo based on their content. Photogrammar has digitized this categorization information including the original caption, photographer, date, and place. By digitizing this information, the Photogrammar team was able to organize the photos by state and county. Photos are also searchable by tag.
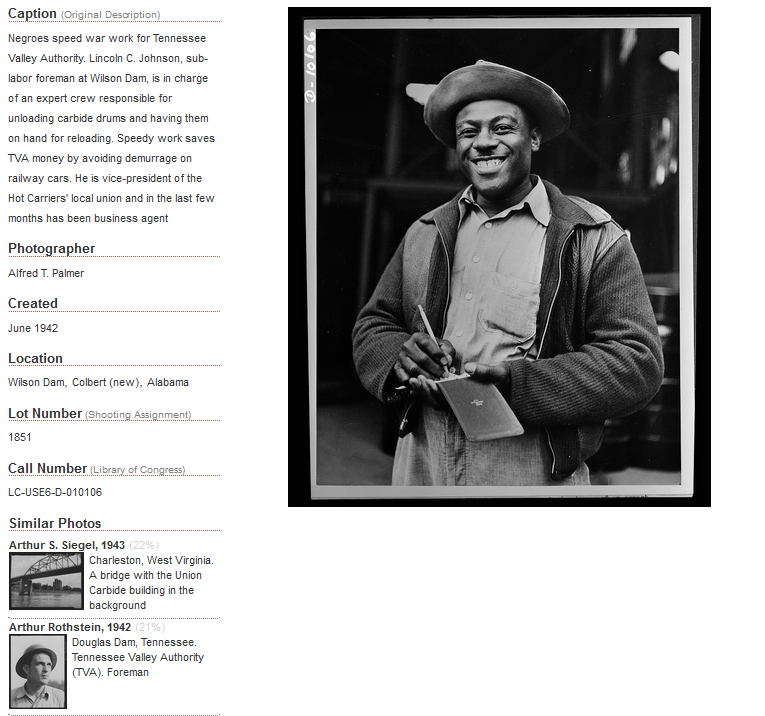
Source: photogrammar.yale.edu
While the general content for this project is on the Photogrammar site, the creators are still developing tools to help users look at different topics, photographers, and regions. A tool called the Metadata Dashboard shows information on photographers, tags, and the number of photographs taken in relation to each other, by state and county. Users can look at all of the tags and photographers for a county or just one tag. Looking at one tag, the dashboard show how many of the photos in that tag were taken by each photographer. This tool is still under development and is only available for the state of California right now. The Photogrammar website will also have a tool soon called ColorSpace that allows users to search through colorized photos.
Among the scholarly primitives used in the project are discovering and illustrating. By digitizing the OWI photographs, transcribing their notes, and organizing them both regionally and by tag, users can discover trends in the places photographed and the topics that were of most interest to the OWI. The organization of these photos on a map illustrates and helps users visualize where OWI photographers’ activity was. Looking at the images in each region helps illustrate in users’ minds the conditions and lifestyles of Americans across the country during the Great Depression.
Photogrammar gives a lot of background on the FSA and the OWI, but they give no context as to their own motivations for creating the project. Some of the photos could have used more classification tags than they had. It would have been helpful for people on the Photogrammar team to add more classification tags where needed. On the other hand, the searchability using these tags was very helpful and the photos were organized not only by region, but by date, which made them easy to search through. The site has many interactive tools that allow users to look at the data from different angles including the Treemap and Metadata Dashboard.
